
Welcome to the energy data page for 1 Victoria Street, London.
Energy consumption and CO2 emissions data are published here in graphical and csv data file formats.
Download the raw data
in .csv format:
Data collected by Stark
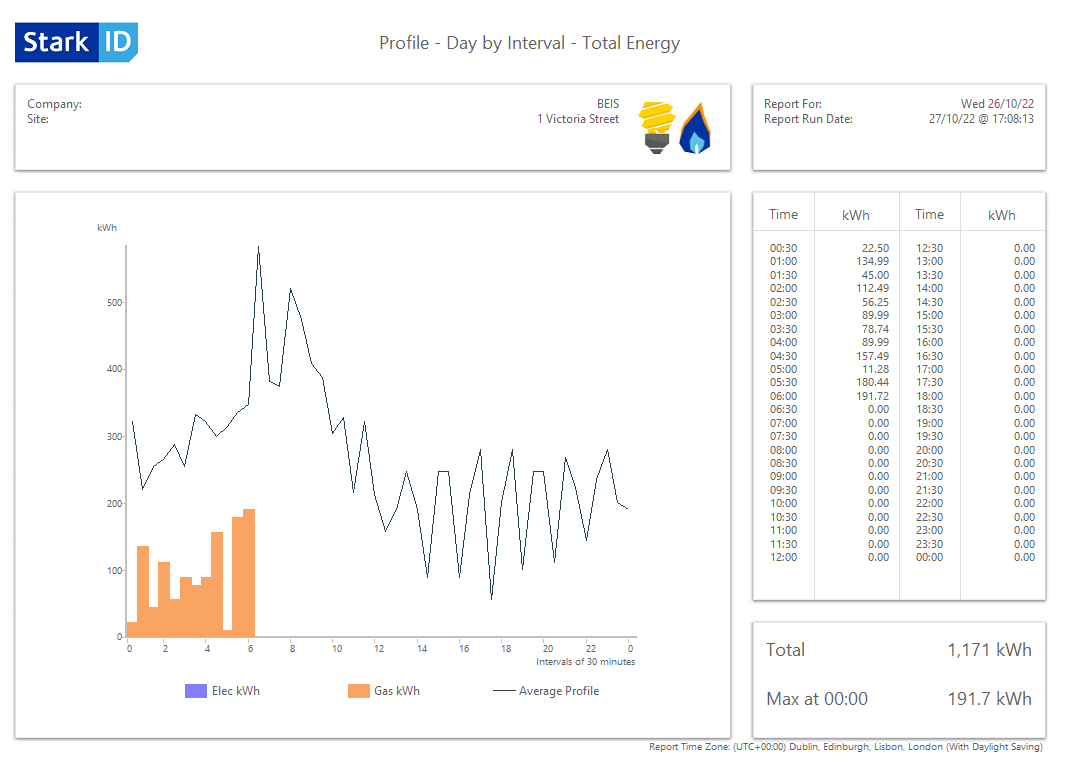
BEIS' partners, Stark and Siemens, have installed a range of remotely-read Automatic Meter Reading (AMR) devices that record consumption every half hour throughout the estate.
Through this, we can see how the building’s consumption changes throughout the day, and how that relates to local temperature, occupancy patterns and daylight hours.
This allows us to identify any key energy use changes and take remedial action.
The raw data is collected from our AMR devices in Greenwich Mean Time (GMT) and is provided as a row of 48 half-hourly values for each day. To directly compare this data to the graphical reports, you will need to adjust the data in the summer months to account for the winter/summer (GMT/BST) clock shift.
The data displayed in the graphical reports is adjusted to 'clock time' (taking account of the winter/summer clock shift) to visualise that data more easily. This allows you to compare consumption to working hours etc.